Site Reliability Engineering: How Google Runs Production Systems - Betsy Beyer, Chris Jones, Jennifer Petoff, Niall Richard Murphy
— books, coding & tutorials — 29 min read
About the book
- Read online
- Buy on Amazon
- Goodreads reviews
- Pages: 550
Quotes
Some random quotes from beginning to end order. For the full context, please buy and read the book. I do this to help myself to quickly get the main ideas of the book.
Part I. Introduction
Chapter 1: Introduction
"Hope is not a strategy" - Traditional SRE saying
Tenets of SRE: availability, latency, performance, efficiency, change management, monitoring, emergency response & capacity planning
Part II. Principles
Chapter 3: Embracing Risk
Managing service reliability is largely about managing risks, and managing risks can be costly.
100% is probably never be the right reliability target: not only it is impossible to achieve, it;s typically more reliability than a service's users want or notice. Match the profile of the service to the risk the business is will to talk.
An error budget aligns incentives and emphasizes joint ownership between SRE and product development. Error budgets make it easier to decide the rate of release and to effectively defuse discussions about outage with stakeholders, and allows multiple teams to reach the same conclusion about production risk without rancor.
Chapter 4: Service Level Objectives
SLI: carefully defined quantitative measure of some aspect of the level of service that is provided, for example: request latency, system throughput, availability, durability
SLO: a target value or range of values for SLI, for example SLI <= target or lower bound <= SLI <= upper bound.
SLA: an explicit or implicit contract with your uses that includes consequences of meeting (or missing) the SLOs they contain. The consequences are most easily recognized when they are financial, a rebate or a penalty.
Chapter 5: Eliminating Toil
"If a human operator needs to touch your system during normal operations, you have a bug. The definition of normal changes as your system grows." - Carla Geisser, Google SRE
Toil is the kind of work tied to running a production service that tends to be manual, repetitive, automatable, tactical, devoid of enduring value, and that scales linearly as a service grows
At least 50% of each SRE's time should be spent on engineering project work that will either reduce future toil or add service features.
Too much toil is bad: career stagnation, low morale, creates confusion, slow progress, sets precedent, promotes attrition, causes breach of faith.
Chapter 6: Monitoring Distributed Systems
Definitions
Monitoring: collecting, processing, aggregating, and displaying real-time quantitative about a system
White-box monitoring: based on metrics exposed by the internals of the system
Black-box monitoring: testing externally visible behavior as a user would see it
Dashboard: dashboard providing a summary view of a service's core metrics.
Alert: a notification intended to be read by a human and that is pushed to a system such as a bug or ticket queue, an email alias, or a pager.
Root case: a defect in a software or human system that, if repaired, instills confidence that this event won't happy again in the same way.
Node and machine: used interchangeably to indicate a single instance of a running kernel in either a physical server, virtual machine, or container.
Why Monitor?
- Analyzing long-term trends
- Comparing over time or experiment groups
- Alerting
- Building dashboards
- Conducting ad hoc retrospective analysis
The 4 Golden Signals
- Latency: the time it takes to serve a request. It's important to distinguish between the latency of successful and failed requests
- Traffic: how much demand is being placed on the system, measured in a high-level system-specific metric.
- Errors: rate of requests that fail, explicitly (status 500), implicitly (status 200 with errors), or by policy.
- Saturation: how "full" the service is. Upper bounds of CPU utilization, network bandwidth, memory. Measuring 99th percentile response over time over some small window (e.g. 1 minute) can give a very early signal of saturation.
Chapter 9: Simplicity
"The price of reliability is the pursuit of the utmost simplicity." - C.A.R. Hoare, Turing Award lecture
A good summary of the SRE approach to managing system is: "At the end of the day, our job is to keep agility and stability in balance in the system".
It sometimes makes sense to sacrifice stability for the sake of agility. For the majority of production software systems, we want a balanced mix of stability and agility.
We don't want our programs to be spontaneous and interesting:; we want to to stick to the script and predictably accomplish their business goals.
A smaller project is easier to understand, easier to test, and frequently has fewer defects.
Writing clear, minimal APIs is an essential aspect of managing simplicity in a software system. In software, less is more! A small, simple API is usually also a hallmark of a well-understood problem.
Simple releases are usually better than complicated releases. It is much easier to measure and understand the impact of a single change rather than a batch of changes released simultaneously.
Software simplicity is a prerequisite to reliability.
Part III. Practices
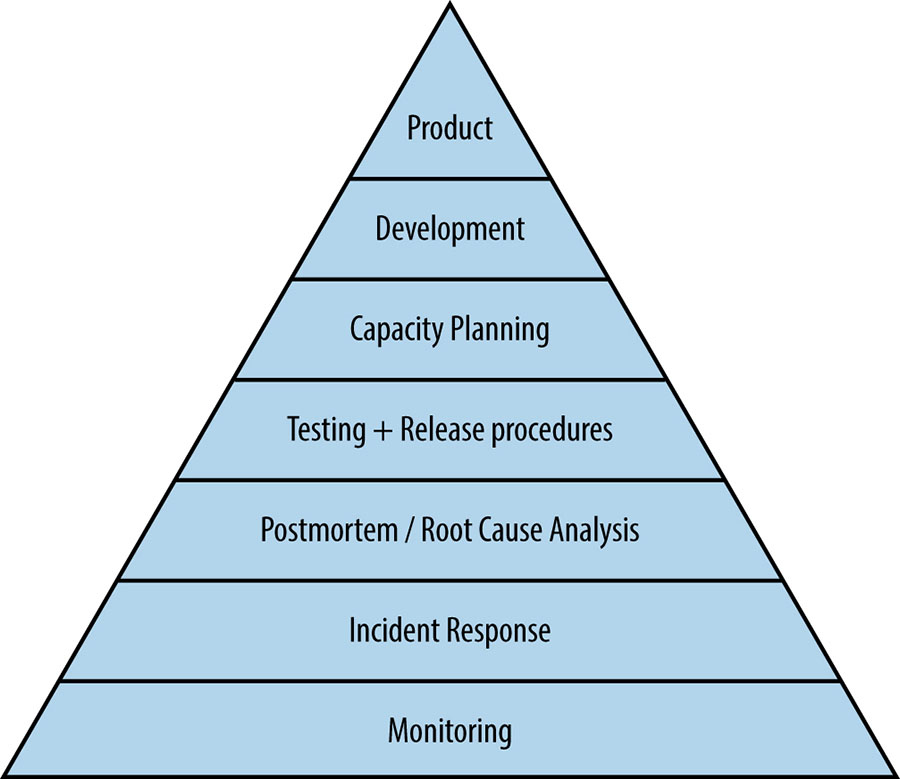
Service Availability Hierarchy
Monitoring: without monitoring, you have no way to tell whether the server is even working
Incident Response: SREs don't go on-call merely for the sake of it: rather, on-call support is a tool we use to achieve our larger mission and remain in touch with how distributed computing systems actually works (and fail!)
Postmortem and Root-Cause analysis: building a blameless postmortem culture is the first step in understanding what went wrong (and what went right!)
Testing: once we understand what tends to go wrong, our next step is attempting to prevent it, because on ounce of prevention is worth a pound of cure
Capacity Planning: naturally following capacity planning, load balancing ensures we're properly using the capacity we've built
Development: do significant large-scale system design and software engineering work within the organization
Product: do reliable product launches at scale to try to give users the best possible experience start from Day Zero
Chapter 10: Practical Alerting from Time-Series Data
"May the queries flow, and the pager stay silent." - Traditional SRE blessing
Monitoring enables service owners to make rational decisions about the impact of changes to the service, apply scientific method to incident response, and of course ensure their reason for existence: to measure the service's alignment with business goals
Prometheus
Time-series are stored as sequences of numbers and timestamps, which are referred as vectors. The name of a time-series is a labelset, because it's implemented as a set of labels express as key=value pairs, few important keys: var, job, service, zone. Together, these variables are called variable expression:
{var=http_requests,job=webserver,instance=host0:80,service=web,zone=us-west}
We can query time-series in time, by specifying a duration to the variable express:
{var=http_requests,job=webserver,instance=host0:80,service=web,zone=us-west}[10m]
This returns the last 10 minutes of history of time-series that matched the expression.
Rules: simple algebraic expressions that compute time-series from other time-series. These rules can be quite powerful because they can query the history of a single time-series (e.g. the time axis), query different subsets of labels from many time-series at once (i.e. the space axis), and apply many mathematical operations.
Counters: any monotonically non-decreasing variable: counters only increases in value, such as kilometers driven
Gauges: take any value, show the current state, such as remaining fuel or current speed
the rate() function takes the enclosed expression and returns the total delta divided by the total time between the earliest and latest values.
Alerting: when an alerting rule is evaluated by a Borgmon, the result is either true, in which case the alert is triggered, or false. Experiences show that alerts can "flap" (togge their state quickly); therefore, the rules allow a minimum duration for which the alerting rule must be true before the alert is sent. Typically, this duration is set to at least 2 rule evaluation cycles to ensure no missed collections cause a false start.
Alertmanager: receives Alert RPCs when the rule first triggers, and then again when the alert is considered to be "firing". The Alertmanger is responsible for routing the alert notification to the correct destination. Alertmanager can: inhibit certain alerts when others are active; deduplicate alerts that have same labelsets; fan-in or fan-out alerts based on their labelsets when multiple alerts with similar labelsets fire
Whitebox monitoring does not provide a full picture of the system being monitored; rely solely upon white-box monitoring means that you aren't aware of what the users see. Teams at Google solve this coverage issue with Prober, which runs a protocol check against a target and reports success or failure. Prober can be pointed at either the frontend domain or behind the load balancer. By using both targets, we can detect localized failures and suppress alerts.
Chapter 11: Being On-call
When on-call, an engineer is available to perform operations on production systems within minutes, typically 5 mins for user-facing or otherwise highly time-critical services, and 30 minutes for less time-sensitive systems. Google has flexible alert delivery system: email, SMS, robot call, app.
Response times are calculated to desired service availability, as demonstrated by the following simplistic example: if a user-facing system obtain 99.99% availability in a given quarter, the allowed downtime is around 13 minutes. This constraint implies that the reaction time of on-call engineer has to be in the order of minutes.
One team might employ the secondary as a fall-through for the pages of the primary on-call misses. Another team might specify that the primary on-call handles only pages, while the secondary handles all other non-urgent production activities.
The most important on-call resources are:
- Clear escalation paths
- Well-defined incident-management procedures
- A blameless postmortem culture
Chapter 12: Effective Troubleshooting
"Be warned that being an expert is more than understanding how a system is supposed to work. Expertise is gained by investigating why a system doesn't work." - Brian Redman
"Ways in which things go right are special cases of the ways in which things go wrong." - John Allspaw
Explaining how to troubleshoot is difficult, much like explaining how to ride a bike. Troubleshooting is learnable and teachable.
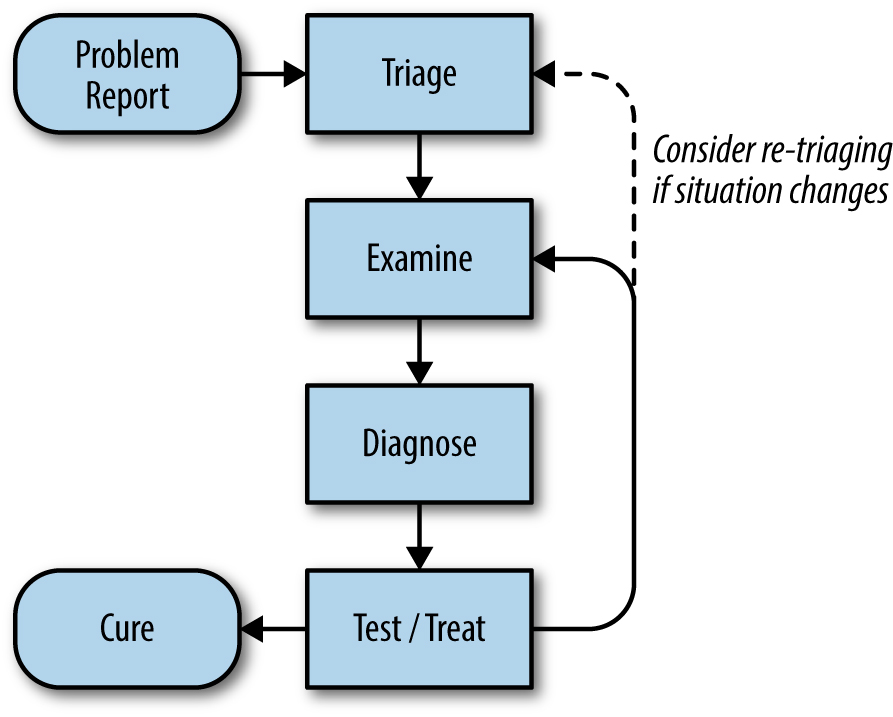
Troubleshooting process
Common Pitfalls:
- Looking at symptoms that aren't relevant or misunderstanding of the meaning of th system metrics.
- Misunderstanding how to change the system, its inputs, or its environments, so as to safely and effectively test hypotheses.
- Coming up with wildly improbable theories about what's wrong, or latching on the causes of past problems, reasoning that since it happened once, it must be happening again.
- Hunting down spurious correlations that are actually coincidences or are correlated with shared causes.
A malfunctioning system is often still trying to do something - just not the thing you want it to be doing. Finding out what it's doing, then asking why it's doing that and where is resources are being used or where its output is going can help you understand how things have gone wrong (refer to "Five Whys" technique introduced by Taiichi Ohno).
There are many good examples of how to adopt a systematic approach to troubleshooting, I suggest read the whole chapter from the book link
Chapter 13: Emergency Response
Things break; that's life.
Regardless of the stakes involved or the size of an organization, one trait that's vital to the long-term health of an organization, and that consequently sets that organization apart from others, is how the people involved response to an emergency. A proper response takes preparation and periodic, pertinent hands-on training.
Time and experience have shown that systems will only break, but will break in ways that one could never previously imagine. One of the greatest lessons Google has learned is that a solution exits, even if it may not be obvious, especially to the person whose pager is screaming. If you can't think of a solution, cast your net farther. Involve more of your teammates, seek help, do whatever you have to do, but do it quickly. The highest priority is to resolve the issue at hand quickly. Oftentimes, the person with the most state is the one whose actions somehow triggered the event. Utilize that person.
Very importantly, once the emergency has been mitigated, do not forget to set aside time to clean up, write up the incident and to learn from the past. Don't repeat it.
There is no better way to lean than to document what has broken in the past. History is about learning from everyone's mistakes. Be thorough, be honest, but most of all, ask hard questions. Look for specific actions that might prevent such an outage from recurring, not just tactically, but also strategically. Ensure that everyone within the company can learn what you have learned by publishing and organizing postmortems. Once you have a solid track record for learning from past outages, see what you can do to prevent future ones.
When it comes to failures, theory and reality are two very different realms. Don't rely on assumptions or what you can't or haven't tested.
And as our systems evolve the cycle continue, which each outage or test resulting in incremental improvements to both processes and systems.
Chapter 14: Managing Incidents
Effective incident management is key to limiting the disruption caused by an incident and restoring normal business operations as quickly as possible.
- incident commander assigns responsibilities according to need and priority
- operational lead applies operational tools
- communicator issues periodic updates to the incident response team and stakeholders
Best Practices:
- Prioritize: stop the bleeding, restore service, and preserve the evidence for root-causing
- Prepare: develop and document your incident management procedures in advance, in consultation with incident participants
- Trust: give full anatomy within the assigned role to all incident participants
- Introspect: pay attention to your emotional state while responding to an incident. If you start to feel panicky or overwhelmed, solicit more support
- COnsider alternatives: periodically consider your options and re-evaluate whether it sill makes sense to continue what you're doing or whether you should be taking another tack in incident response
- Practice: use the process routinely so it becomes second nature
- CHange it around: were you incident commander last time? Take on different role this time. Encourage every team member to acquire familiarity with each role
Chapter 15: Postmortem Culture: Learning from failure
"The cost of failure is education" - Devin Carraway
Incidents and outages are inevitable given our scale and velocity of change. WHen an incident occurs, we fix the underlying issue, and services return to their normal operating conditions. Left unchecked, incidents can multiply in complexity or even cascade, overwhelming a system and its operators and ultimately impacting our users. Therefore, postmortems are an essential tool for SRE
A postmortem is a written record of an incident, its impact, the actions taken to mitigate or resolve it, the root cause(s), and the follow-up actions to prevent the incident from recurring
Best practices:
- Avoid blame and keep it constructive: a blamelessly written postmortem assumes that everyone involved in an incident had good intentions and did the right thing with the information they had
- No postmortems left unreviewed: an unreviewed postmortem might as well never have existed
- Visibly reward people for doing the right thing
- Ask for feedback on postmortem effectiveness
Chapter 16: Tracking Outages
Improving reliability over time is only possible if you start from a known baseline and can track progress. Systematically learning from past problems is essential to effective service management
Chapter 17: Testing for Reliability
"If you haven't tried it, assume it's broken" - Unknown
Confidence can be measured both by past reliability and future reliability. The former is captured by analyzing data provided by monitoring historic system behavior, while the latter is quantified bymaking predictions from data about past system behavior.
Testing is the mechanism you use to demonstrate specific areas of equivalence when changes occur. Thorough testing helps us predict the future reliability of a given site with enough detail to be practically useful.
As the percentage of your codebase covered by tests increases, you reduce uncertainty and potential decrease in reliability from each change. Adequate testing coverage means that you can make more changes before reliability falls below an acceptable level. If you make too many changes too quickly, the predicted reliability approaches the acceptability limit. At this point, you may want to stop making changes while new monitoring data accumulates.
MTTR & MTBF
A monitoring system can uncover bugs, not only as quickly as the reporting pipeline can react. The Mean Time to Repair (MTTR) measures how long it takes the operations team to fix the bug, either through a rollback or another action.
It's possible for a testing system to identify a bug with 0 MTTR. 0 MTTR occurs when a system-level test is applied to a subsystem, and that test detects the exact same problem that monitoring would detect. The more bugs you can find with 0 MTTR, the higher the Mean Time Between Failure (MTBF) experienced by users.
As MTBF increases in response to better testing, developers are encouraged to release features faster. Some of these features will, of course, have bugs. New bugs result in an opposite adjustment to release velocity as these bugs are found and fixed.
Development Test evaluates the correctness of software offline during development. Production Tests are performed on a live web service to evaluate whether a deployed software system is working correctly.
Traditional Tests
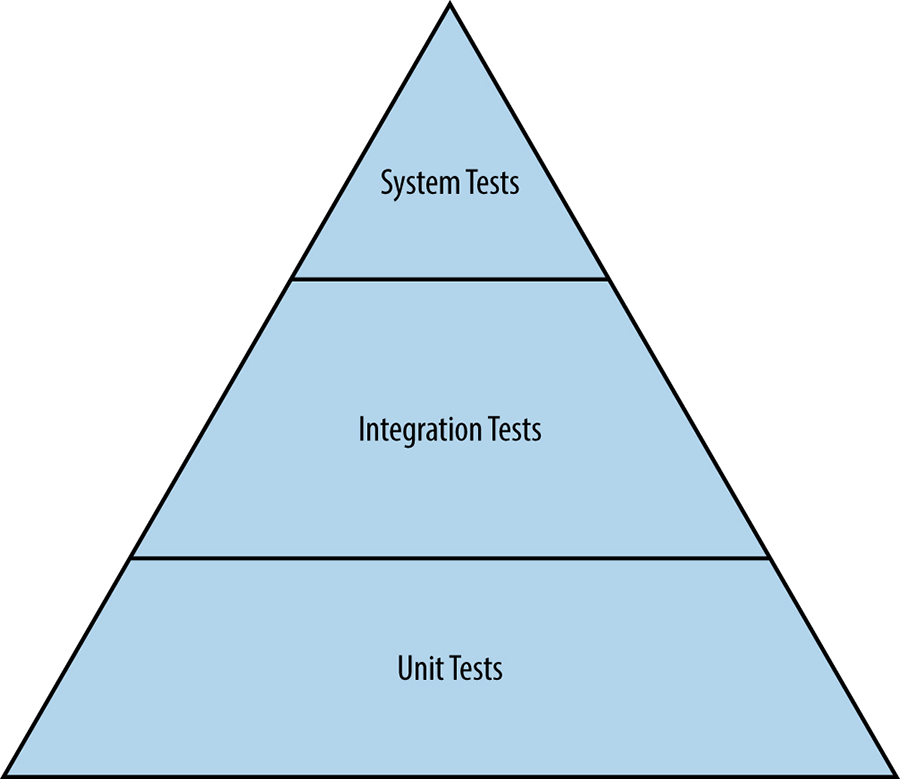
Hierarchy of traditional tests
Unit tests
A unit test is a smallest and simplest form of software testing, to assess a separable unit of software. such as a class or a function. Unit tests are also employed as a specification to ensure that a function or module exactly performs the behavior required by the system.
Integration tests
Software components that pass individual unit tests are assembled into larger components. Engineers then tun an integration test on an assembled component to verify that it functions correctly.
System tests
A system test is the largest scale test that engineers run for an undeployed system. All modules belonging to a specific component, such as a server that passed integration tests, are assembled into the system. System tests come in many different flavors: smoke tests (sanity test), performance tests & regression tests.
Production Tests
These tests are in many way similar to black-box monitoring, and are therefore sometimes called black-box testing.
Configuration test
Configuration tests are built and tested for a specific version of the checked-in configuration file. Comparing which version of the test is passing in relation to the goal version for automation implicitly indicates how far actual production currently lags behind ongoing engineering work. The tests become more complex when the configuration does one of the following:
- Implicitly incorporates defaults that are built into the binary (meaning that the tests are separately versioned as a result)
- Passes through a preprocessor such as bash into command-line flags (rendering the tests subject to expansion rules)
- Specifies behavioral context for a shared runtime (making the tests depend on runtime's release schedule)
Stress test
In order to safely operate a system, SREs need to understand the limits of both the system and its components. In many cases, individual components don't gracefully degrade beyond a certain point - instead, they catastrophically fail. Engineers use stress tests to find the limits on a web service:
- how full can a database get before writes start to fail?
- how many queries a second can be sent to an application server before it becomes overloaded, causing requests to fail?
Canary test
The term canary comes from the phrase "canary in a coal mine", and refers to the practice of using a live bird to detect toxic gases before humans were poisoned. To conduct a canary test, a subset of server is upgraded to a new version of configuration and then left in an incubation period. A canary test isn't really a tes; rather, it's a structured user acceptance and is more ad hoc.
Creating a Test and Build Environment
One way to establish a strong testing culture is to start documenting all reported bugs as test cases. If every bug is converted into a test, each test is supposed to initially fail because the bug hasn't yet been fixed. As engineer fix the bugs, the software passes testing and you're on the road to developing a comprehensive regression test suite.
Once source control is in place, you can add a continuous build system that builds the software and runs tests every time code is submitted. It is essential that the latest version of a software project in source control is working completely. When the build system notifies engineers about broken code, they should drop all of their other tasks and prioritize fixing the problem:
- it's usually harder to fix what's broken if there are changes to the codebase after the defect is introduced
- broken software slows down the team because they must work around the breakage
- release cadences, such as nightly and weekly builds, lose their values
- the ability of the team to respond to a request for an emergency release becomes much more complex and difficult
Testing is one of the most profitable investments engineers can make to improve the reliability of their product. Testing isn't an activity that happens once or twice in the lifecycle of a project; it's continuous. The amount of effort required to write good tests is substantial, as is the effort to build and maintain infrastructure that promotes a strong testing culture. You can't fix a problem until you understand it, and in engineering,, you can only understand a problem by measuring it
Chapter 18: Software Engineering in SRE
There are many examples with context, suggested to read the whole chapter link
Chapter 19: Load Balancing at the frontend
Let's start by reviewing 2 common traffic scenarios: a basic search request and a video upload request
- the search request is sent to the nearest available data center - as measured in round-trip time (RTT) - because we want to minimize the latency on the request
- the video upload stream is routed via a different path - perhaps to a link that is currently underutilized - to maximize the throughput at the expense of a latency
Some requests may be directed to a datacenter that is slightly farther away in order to keep caches warm, or non-interactive traffic may be routed to a completely different region to avoid network congestion
Load Balancing using DNS
Before a client can even send an HTTP request, it often has to look up an IP address using DNS. This provides the perfect opportunity to introduce our first layer of load balancing: DNS load balancing. The simplest solution is to return multiple A or AAAA records in the DNS reply and let the client pick an IP address arbitrarily.
However it provides very little control over the client behavior: records are selected randomly, and each will attract a roughly equal amount of traffic. Another problem is that the client cannot determine the closest address. End users rarely talk to authoritative nameservers directly. Despite all of the problems, DNS is still the simplest and most effective way to balance load before the user's connection even starts
Load Balancing at the Virtual IP Address
Virtual IP addresses (VIPs) are not assigned to any particular network interface. Instead, they are usually shared across many devices. However, from the user's perspective, the VIP remains a single, regular IP address. In practice, the most important part of VIP implementation is a device called the network load balancer. The balancer receives packets and forwards them to one of the machines behind the VIP. These backends can then further process the request. The first and most intuitive approach is to always prefer the least loaded backend. Unfortunately, this logic breaks down quickly in the case of stateful protocols, which must the the same backend for the duration of a request. Proposed in 1997, consistent hashing describes a way to provide a mapping algorithm that remains relatively stable even when new backends are added to or removed from the list
Another solution is to modify information on the data link layer (layer 2 of the OSI networking model). By changing the destination MAC address of a forwarded packet, the balancer can leave all the information in upper layers intact, so the backend receives the original source and destination IP addresses. Package encapsulation is a powerful mechanism that provides great flexibility in the way our networks are designed and evolve
Chapter 20: Load Balancing in the Datacenter
In an ideal case, the load for a given service is spread perfectly over all its backend tasks and, at any given point in time, the least and most loaded backend tasks consume exactly the same amount of CPU
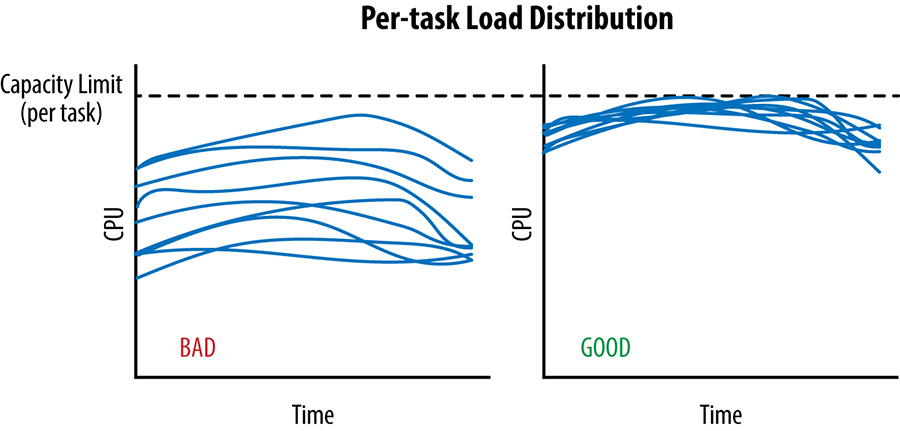
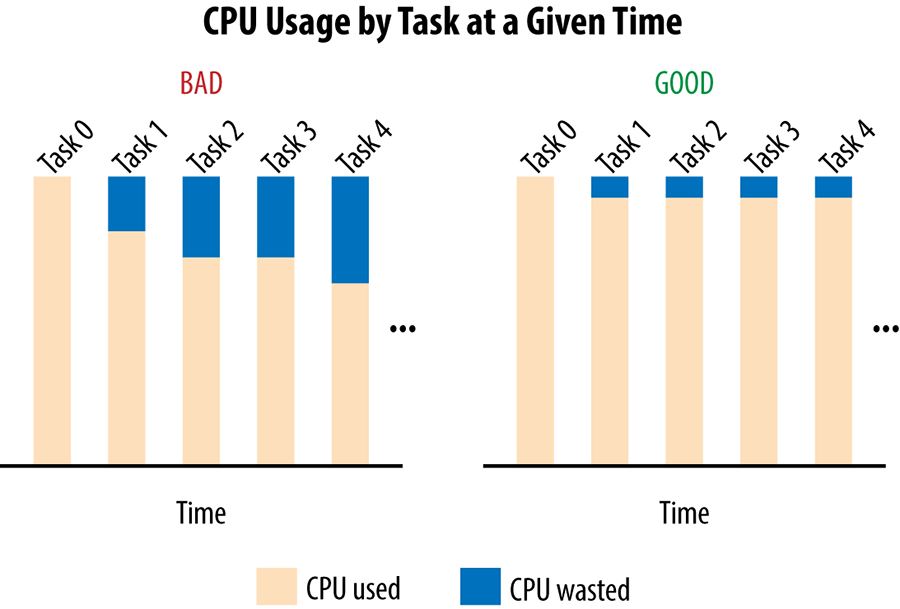
Assume our client tasks track the number of active requests they have sent on each connection to a backend task. When this active request count reaches a configured limit, the client treats the backend as unhealthy and no longer send it requests. Unfortunately, this very simplistic approach only protects backend tasks against very extreme forms of overload and it's very easy for backend to become overloaded well before this limit is ever reached. The converse is also true: in some cases, clients may reach this limit when their backend still have plenty of spare resources
connection distribution with 300 clients, 300 backends, and random subsetting size of 30%
connection distribution with 300 clients, 300 backends, and random subsetting size of 10%
connection distribution with 300 clients, 300 backends, and deterministic subsetting to 10 of 300 backends
Simple Round Robin: each client sends requests in round-robin fashion to each backend task in its subset to which it can successfully connect and which isn't in lame duck state. While this approach has the advantage of being simple and performing significantly better than just selecting backend tasks randomly, the result of this policy can be very poor:
- small subsetting: the clients may not issue request at the same rate
- varying query costs: many services handle requests that require vastly different amounts of resources for processing
- machine diversity: not all machines in the same datacenter are necessarily the same
- unpredictable performance factors: the performance may differ vastly due to several unpredictable aspects that cannot be accounted for statically: antagonistic neighbors & task restarts
Least-Loaded Round Robin: each client task keeps track of the number of active requests it has to each backend task in its subset and use Round Robin among the set of tasks with a minimal number of active requests. This approach has 2 important limitations:
- the count of active requests may not be a very good proxy for the capability of a given backend: many requests spend a significant portion of their life just waiting for a response from the network and very little time on actual processing
- the count of active requests doesn't include requests from other clients to the same backend
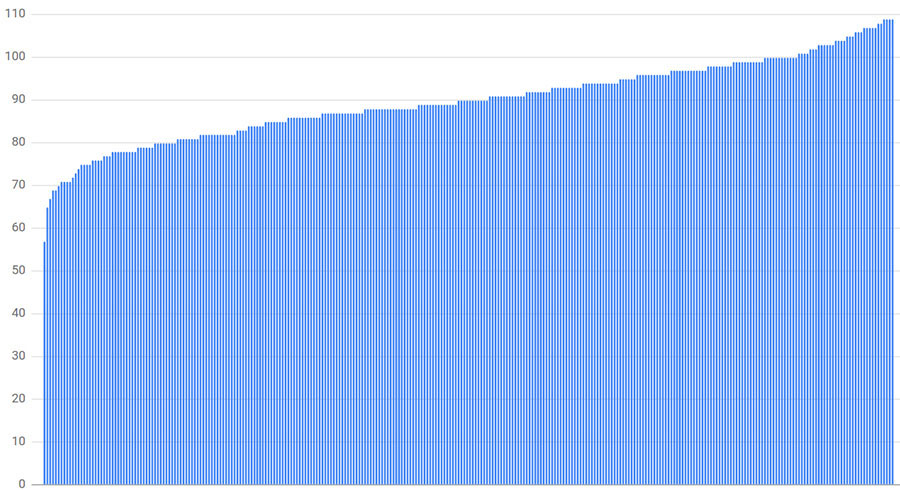
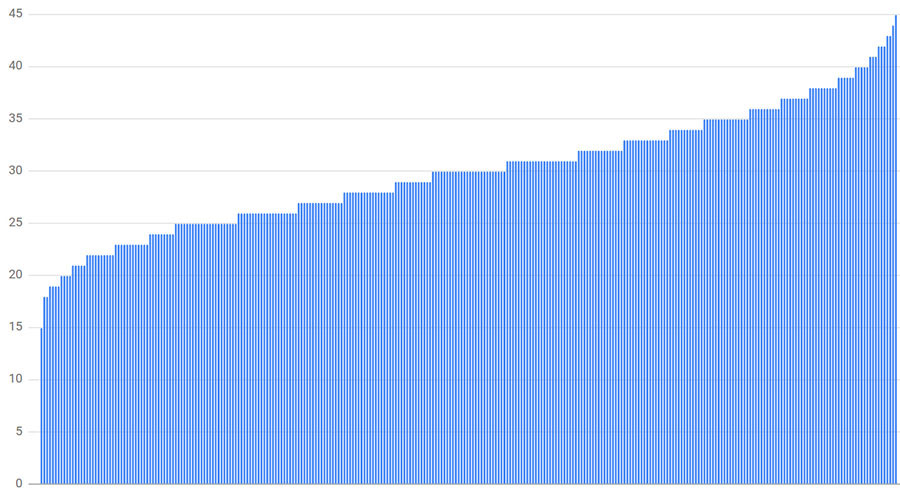
Weighted Round Robin: this approach incorporates backend-provided information into the decision process. In practice, Weighted Round Robin has worked very well and significantly reduced the difference between the most and the least utilized tasks
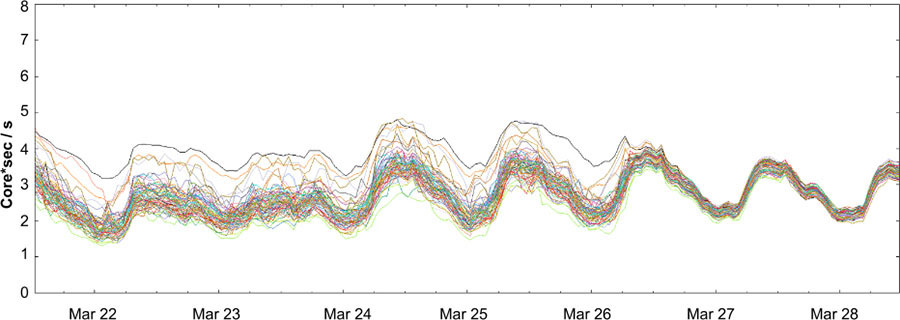
CPU distribution before and after enabling Weighted Round Robin
Chapter 21: Handling Overload
Avoiding overload is a goal of load balancing policies. But no matter how efficient your load balancing policy, eventually some part of your system will become overloaded. Gracefully handling overload conditions is fundamental to running reliable serving system
One option for handling overload is to serve degraded responses: responses that are not as accurate as or that contain less data than normal responses, but that are easier to compute. For example:
- instead of searching an entire corpus to provide the best available results to a search query, search only a small percentage of the candidate set
- rely on local copy of results that may not be fully up to date but that will be cheaper to use than going against the canonical storage
At the end of the day, it's best to build clients and backend to handle resource restrictions gracefully: redirect when possible, serve degraded results when necessary, and handle resource errors transparently when all else fails
The Pitfalls of "Queries per Second"
Different queries an have vastly different resource requirements. A query's cost can vary based on arbitrary factors such as the code in the client that issues them or even the time of the day.
Modeling capacity as QPS or using static features of the requests that are believed to be a proxy for the resources they consume often makes for a poor metric. Even if these metrics perform adequately at one point in time, the ratios can change. Sometimes the change is gradual, but sometimes the change is drastic. A moving target makes a poor metric for designing and implementing load balancing
A better solution is to measure capacity directly in available resources. In majority of cases, using CPU consumption as the signal for provisioning works well:
- in platforms with garbage collection, memory pressure naturally translates into increased CPU consumption
- in other platforms, it's possible to provision the remaining resources in such a way that they're very unlikely to run out before CPU runs out
Per-Customer limits
We aggregate global usage information in real time from all backend tasks, and use that data to push effective limits to individual backend tasks. An interesting part of the puzzle is computing in real time the amount of resources, specifically CPU, consumed by each request
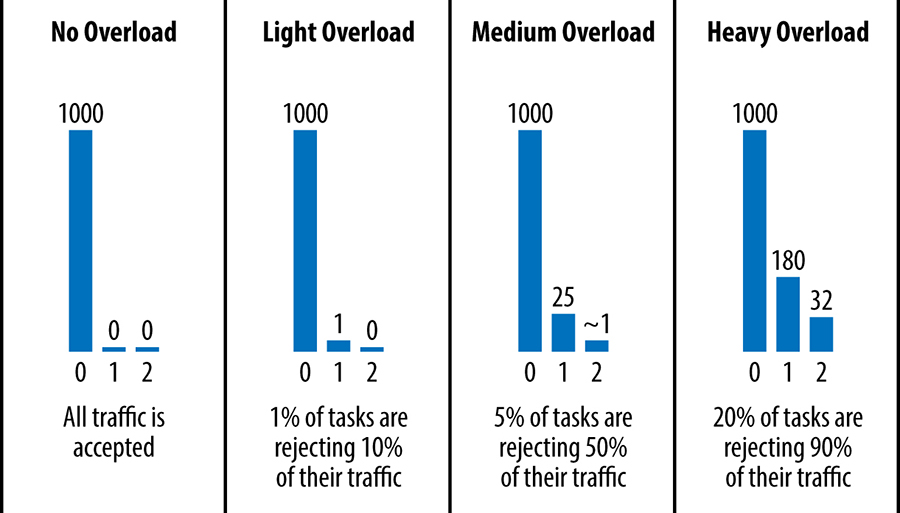
Client-Side Throttling
When a client detects that a significant portion of its recent requests have been rejected due to "out of quota" errors, it starts self-regulating and caps the amount of outgoing traffic it generates. By allowing more requests to reach the backend than are expected to actually be allowed, we waste more resources at the backend, but we also speed up the propagation of state from the backend to the clients. Adaptive throttling works well in practice, leading to stable rates of requests overall
Criticality
- when a customer runs out of global quota, a backend task will only reject requests of a given criticality if it's already rejecting all requests of all lower criticalities
- when a task is itself overloaded, it will reject requests of lower criticalities sooner
- the adaptive throttling system also keeps separate stats for each criticality
Utilization Signals
In many cases, the utilization is just a measurement of the CPU rate, but in some cases it can also be memory reserved that is currently being used. The system can also be configured to combine multiple signals and reject requests that would surpass the combined target utilization thresholds
Handling Overload Errors
If a small subset of backend tasks in the datacenter are overloaded, requests should not be retried and errors should bubble up all the way to the caller. Retries of request are indistinguishable from new requests. Even if a backend is only slightly overloaded, a client request is often better served if the backend rejects retry and new requests equally and quickly. These requests can be retried immediately on a different backend task that may have spare resources
Deciding to Retry
First, we implement a per-request retry budget of up to 3 attempts. If a request has already failed three times, we let the failure bubble up to the caller. It's unlikely that attempting it again will help because the whole datacenter is likely overloaded
Second, we implement per-client retry budget. Each client keeps track of the ratio of request that correspond to retries. A request will only be retried as long as this ratio is below 10%. The rationale is that if only a small subset of tasks are overloaded, there will be relatively little need to retry
Third, clients include a counter of how man times the request has already been tried in the request metadata. When a backend needs to reject a request, it consults these histograms to determine the likelihood that other backend tasks are also overloaded
Histograms of attempts in various conditions
Load from Connections
A large pool of connections can cost a lot of CPU and memory or a fast rate of churn of connections. Such issues are negligible in small systems, but quickly become problematic when running very large-scale RPC systems. Solutions:
- expose the load to the cross-datacenter balancing algorithm
- batch client jobs use a separate set of batch proxy backend tasks that do nothing but forward requests to the underlying backends and hand their responses back to the clients in a controlled way
Conclusions
A backend task provisioned to serve a certain traffic rate should continue to serve traffic at that rate without any significant impact on latency, regardless of how much excess traffic is thrown at the task.. As work piles up and tasks eventually run out of memory and crashm latency suffers as traffic is dropped and tasks compete for resources. Left unchecked, the failure in a subset of a system might trigger the failure of other system components, potentially causing the entire system to fail
It's a common mistake to assume that an overloaded backend should turn down and stop accepting all traffic. We actually want the backend to continue accepting as much traffic as possible, but to only accept that load as capacity frees up. A well-behaved backend, supported by robust load balancing policies, should accept only the requests that it can process and reject the rest gracefully
Load balancing requires deep understanding of a system and the semantics of its requests
Chapter 22: Addressing Cascading failures
"If at first you don't succeed, back off exponentially" - Dan Sandler
"Why do people always forget that you need to add a little jitter" - Ade Oshineye
A cascading failure is a failure that grows over time as a result of positive feedback. It can occur when a portion of an overall system fails, increasing the probability that other portions of the system fail
Server Overload
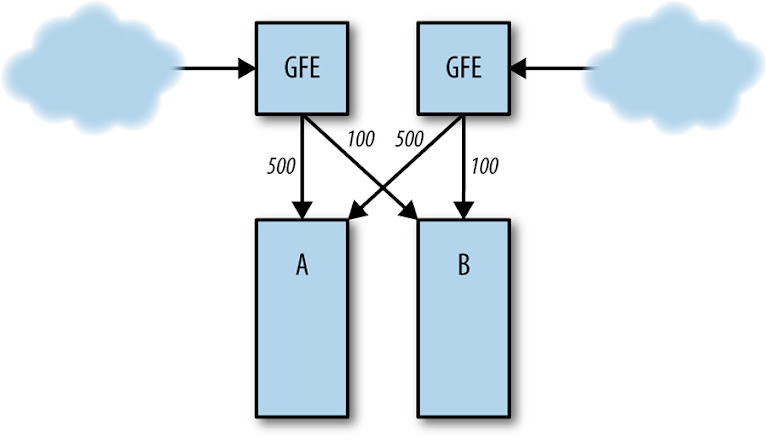
Normal server load distribution between clusters A and B
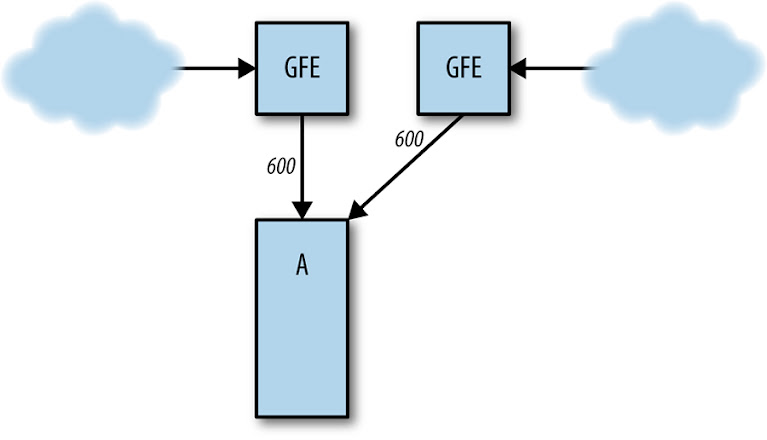
Cluster B fails, sending all traffic to cluster A
Resource Exhaustion
CPU
- increased number of in-flight request
- excessively long queue lengths
- thread starvation
- CPU or request starvation
- missed RPC deadlines
- reduced CPU caching benefits
Memory
- dying tasks
- increased rate of garbage collection, resulting in increased CPU usage
- reduced in cache hit rates
Thread starvation
Running out of file descriptor